
The 2023/24 Premier League season generated an enormous trail of numbers on official and independent stats websites, from basic goals and assists to advanced expected goals tables. Turning that raw data into practical match selection is less about memorising every metric and more about knowing which pages to check, in what order, and how each stat should change your decision before you stake.
Why stats websites matter for choosing Premier League matches
Premier League matches in 2023/24 were played in a high‑scoring environment with clear differences between top attacks and weaker defences, making simple league tables an incomplete guide to true strength. Stats websites that consolidate goals, shots, and xG allowed bettors to see whether a team’s results were backed by sustainable chance creation or flattered by finishing streaks and luck. Using those pages systematically turned match selection into a repeatable process, where every chosen fixture had a clear data‑based reason to be on the shortlist rather than just a gut feel.
Mapping the main types of stats pages to betting decisions
Different stats pages answer different questions, so starting with a mental map of what each type offers prevents you from drowning in numbers that do not move your decision. Official league stats hubs present tables for goals, assists, clean sheets, and defensive records, while independent sites and Opta‑powered hubs add xG, xGA, and xG‑based league tables that estimate what should have happened. In 2023/24, combining these sources made it easier to decide whether to focus on match winners, handicaps, or goals markets, because you could see both actual outcomes and underlying process.
Common stats pages and what they are good for
Before choosing any Premier League 2023/24 match, it helps to know which pages answer which kind of question, so you can visit them in a deliberate order rather than randomly clicking through tables.
- Official league stats index: club goals for/against, clean sheets, and discipline, useful for quick attack/defence profiles.
- Scoring and assist leaderboards: individual attackers’ form and involvement in goals, relevant for goal‑scorer and shots markets.
- Stats‑centre overviews: combined tables of best attack, best defence, form guides, and home/away splits, ideal for initial match filtering.
- xG and xG table pages: expected goals for/against and expected goal difference, vital for spotting over‑performers and under‑performers.
- Advanced data exports or dashboards: team and player‑level datasets on sites and repositories, useful for deeper patterns or custom models.
The real value of this mapping is that it lets you match each betting question to one or two specific pages instead of scanning everything every time. If you are only deciding whether a game belongs in an over/under shortlist, you can jump straight to attack/defence tables and xG summaries; if you are evaluating a team’s consistency, you might pair the league table with an xG table and a form guide, which saves time and keeps focus.
Starting with basic attack and defence numbers
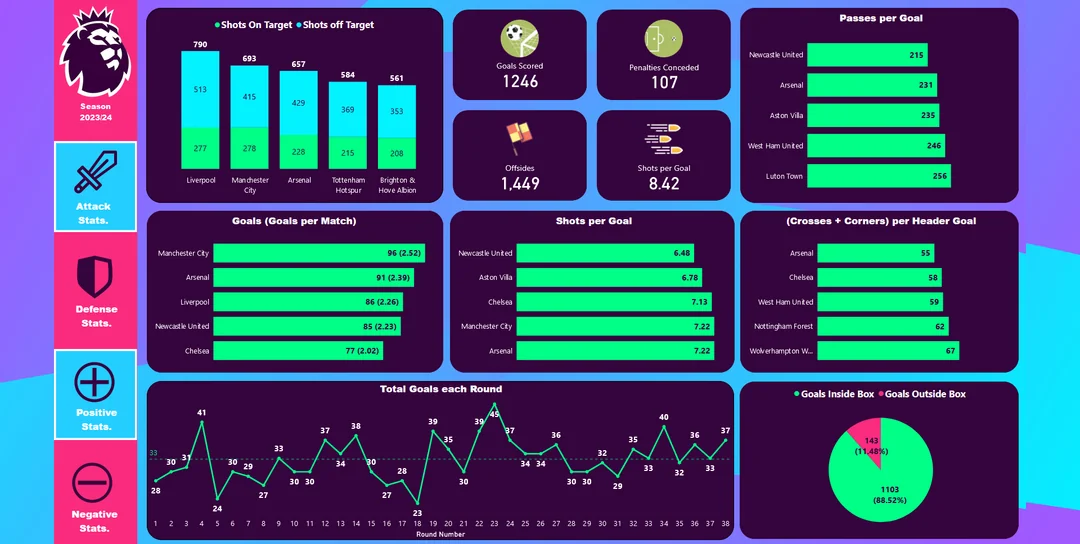
In 2023/24, league‑level stats showed clear separation between top scoring clubs and the rest, with leading sides consistently near or above two goals per game while others struggled both to score and to keep clean sheets. Official stats hubs list “best attack” and “best defence” tables that immediately indicate whether a match pairs strength against weakness or pits similar profiles against each other. That quick structural picture already suggests whether you should look harder at the favourite, consider a handicap, or shift attention to goals markets instead.
If you see a team in the top five for goals scored facing one ranked near the bottom for goals conceded, the simplest consequence is that you are looking at a fixture where the stronger side is likely to generate repeated chances. However, the impact for match selection depends on price and context: a heavily odds‑on favourite might be better approached via handicap or goal lines, while a modestly priced home favourite with strong attack/defence numbers could merit inclusion in singles or as a cautious anchor in a smaller multiple. Without that first table scan, it is easy to overreact to recent narratives and forget that some teams were structurally superior across 38 games, not just over the last fortnight.
Using the xG table to test whether recent results are sustainable
Expected goals tables for 2023/24 highlighted teams whose results either exceeded or lagged behind their chance quality, often by large margins. A club sitting several places higher in the actual table than in the xG‑based table was typically turning chances into goals at an unusually efficient rate or conceding fewer than expected, which rarely continues indefinitely. Conversely, teams with strong xG and poor actual results sometimes represented hidden strength if their finishing or goalkeeping had been temporarily off.
For match selection, this means you can treat the xG table as a second opinion on whether a team’s story is likely to continue. If a mid‑table side with modest actual goals but healthy xG faces an opponent whose league position is inflated by hot finishing, that pairing may justify considering the underrated team at a handicap or double‑chance price. On the other hand, when two over‑performers meet, the clash can be a warning sign that both are due for regression, encouraging you to lower stake size or remove that fixture from your shortlist entirely rather than trusting recent scorelines.
Combining home/away splits with expected goals
Home/away splits mattered especially in 2023/24 because some clubs showed strong performance at their own ground yet remained fragile on the road, both in actual results and in underlying xG. Stats centres and xG pages often separate home and away numbers, allowing you to see whether a team’s strong season headline rests mostly on home matches while its away xG and goals suggest vulnerability. This split is particularly useful when an away favourite is priced short in the market but their underlying attacking output drops significantly when travelling.
If the away side’s xG per game falls from strong levels at home to average on the road, while the host’s home xGA is relatively solid, including that match on a slip as a confident away win becomes harder to justify. Instead, you might shift the angle towards a more cautious outcome, such as a handicap on the home team or an under goals line if both clubs show lower chance creation in that configuration. The impact is that home/away‑adjusted xG stops you from blindly trusting brand names and forces you to check whether their underlying performance travels.
When stats and odds disagree: interpreting contradictions
Sometimes, stats pages and market prices tell different stories: a team with strong xG and solid home numbers may still be a clear underdog due to injuries, recent news, or public perception.
| Situation | What the stats suggest | What the odds suggest | Possible interpretation |
| Strong xG, weak recent results | Team is playing well but not finishing chances | Market prices them as mid/low table | Potential value if key squad is intact |
| Weak xG, high league position | Performance may be flattered by luck or finishing streaks | Favourites or short‑priced | Risk of regression, be cautious with heavy backing |
| Good home xG, poor away xG | Strong only in certain venues | Mixed pricing depending on venue | Adjust interest by location, not reputation |
These contradictions are where stats websites add the most value, because they highlight exactly where the market might be under‑ or over‑reacting to recent narratives. For match selection, the decision is not to simply “trust xG” but to recognise that when statistics and prices diverge sharply—and injuries or tactical changes do not explain it—you may either have a genuine edge worth considering or a fixture whose uncertainty is too high for your risk profile.
Choosing markets based on the strength and shape of stats
The same statistical picture can justify different types of bets depending on which dimension is strongest. A team with the league’s best defence by goals against and xGA, but only average attacking xG, might be more suitable for unders or win‑to‑nil bets than for high‑line handicaps. Conversely, clubs with high xG for and moderate xGA often fit over goals or “both teams to score” profiles better than heavy win margins, especially in a season where overall scoring was elevated.
Selecting the right market type from stats pages effectively translates process into risk structure. If you misalign the two—for example, backing a low‑xG team to cover a large handicap just because they face a weak opponent—you turn potentially useful information into a bet that relies on an unusual outcome. In contrast, aligning strong attacking numbers with goal markets and strong defensive numbers with control‑focused angles reduces the need for extreme performances and makes the stats work for you rather than against you.
In practice, many data‑oriented bettors during 2023/24 executed these stat‑driven choices through a broader digital routine, and some coordinated their activity inside a dedicated betting platform presence such as ufabet168, where they could map specific insights—high attacking xG, solid home xGA, or xG‑based form—onto the exact markets offered, from totals to handicaps, without having to manually search across multiple disconnected services each time they found a statistical edge. That integration did not change the underlying probabilities, but it reduced friction between analysis and execution, making it less likely that time pressure, interface confusion, or missing markets would cause them to abandon or distort the match selection logic derived from the stats websites.
Avoiding common misuses of stats websites
The availability of detailed 2023/24 stats also encouraged several predictable mistakes, especially among bettors new to advanced metrics. One frequent error was cherry‑picking numbers that supported an existing opinion—such as focusing only on top scorers or last five results—while ignoring contradictory xG or defensive tables. Another was treating xG as a guarantee that a team “must” start scoring soon, underestimating how long finishing slumps and over‑performance can persist in real seasons.
To avoid these traps, it helps to define a small, consistent set of stats you will always check before deciding that a match is playable. For example, always pairing the actual league table with an xG table and a form guide forces you to see when a team’s story changes depending on the lens, which encourages humility rather than overconfidence. Over time, this routine reveals which stats were most predictive for your style of betting and which ones mainly added noise, allowing you to refine your selection process instead of expanding it indefinitely.
Integrating stats into a quick pre‑match workflow
Even for data‑driven bettors, time limits during a dense Premier League season made it impractical to perform deep analysis on every fixture. A more realistic approach involved using stats websites to filter matches in stages: first identifying structurally interesting fixtures based on attack/defence and xG tables, then narrowing down to two or three where both stats and prices aligned. This tiered workflow meant that advanced stats were used to focus attention rather than to justify action on every match on the coupon.
A compact routine might start with a stats‑centre overview to see form, best attack, and best defence, move to the xG table for confirmation or contradiction, and then end with home/away splits and top scorer stats for the short‑listed games. The impact of that structure is that every match you end up considering has passed at least three data filters, yet the total time spent per round remains manageable, which is crucial across a 38‑game season with mid‑week fixtures and other commitments.
In parallel with this structured use of numbers, some bettors also had to manage the emotional spillover from non‑sports activity, particularly when moving between football stats tabs and other forms of online wagering on the same device. If a tense or highly volatile session elsewhere—for example, on a casino online website—preceded a visit to stats pages, there was a risk that frustration or excitement would distort how they interpreted neutral xG or goals tables, leading them to overweight aggressive, high‑variance angles even when the data suggested a more balanced view. Recognising this cross‑product influence and deliberately separating stats‑driven match selection from emotionally charged gambling windows helped keep the numbers in their intended role as decision aids rather than tools for justifying impulsive bets.
Summary
Stats websites covering the 2023/24 Premier League season turned match selection into a more transparent process by revealing both headline results and underlying chance quality. Using attack/defence tables, xG rankings, and home/away splits in a structured way allowed bettors to distinguish sustainable performance from short‑term noise before choosing which fixtures deserved attention. Over time, integrating these pages into a disciplined, time‑efficient workflow proved more valuable than chasing every metric, because it aligned each match choice with a clear, repeatable statistical rationale instead of relying on perception alone.